 |
Agranova The world's leading source for information on new crop protection technologies |
|||||||||||||||||||||||||||||||||||||||||||||||||||||||||||||||||||||||||||||||||||||||||||||||||||||||||||||||||||||||||||||||||||||||||||||||||||||||||||||||||||||||||||||||||||||||||||||||||||||||||||
| Home | [ Subscriber log-in] | |||||||||||||||||||||||||||||||||||||||||||||||||||||||||||||||||||||||||||||||||||||||||||||||||||||||||||||||||||||||||||||||||||||||||||||||||||||||||||||||||||||||||||||||||||||||||||||||||||||||||||
|
Agrochemicals in perspective
Analysis of the Worldwide Demand for Agrochemical Introduction Agrochemicals are used principally to control weeds and pests in agriculture. The market for this major application was valued, at the end-user level, at around US$ 31.25 billion in 19981. This market has grown only slowly during the past five years and is forecast to continue to increase at < 1% during the next five years. Agrochemicals are also used in a variety of non-crop applications, which are generally higher value-added products. Demand in this sector is growing at a much healthier 4-5% per year. This global market, valued at US$ 10.5 billion in 19982, includes applications in forestry, leisure (such as home, garden and golf courses) and industrial pest control (such as control of vermin and insects, weed control in towns and on railways). Although the emphasis in this presentation will be on crop applications of agrochemicals, the importance of the non-crop sector should be borne in mind by the present audience, since the non-crop sector accounts for a significant source of demand. The non-crop sector is dominated by insecticides (around a half) and non-selective herbicides. As is the case in most markets for chemicals, the developed economies in the USA, Europe and Japan account for the lion's share of demand, with approximately 70% by value at the end-user level. The North American market accounts for 30% of the total, with Japan and France second and third, respectively. The global market may also be divided into the three main types of agrochemical action: herbicides (47%), insecticides (29%) and fungicides (18%). Other agrochemical applications, mainly fumigants and plant growth regulators, account for the remaining 6% of sales. At this point it is well to recognise that the value of an active ingredient as a proportion of the formulated value is considerably greater for crop agrochemicals than is the case for pharmaceuticals. The worldwide value of agrochemical actives (for crops) is roughly US$ 10-12 billion, making it around one third the size of that for pharmaceutical ingredients at US$ 30-40 billion. Demand for Agrochemical Active Ingredients In order to develop a successful business supplying chemicals to the agrochemical industry, producers need to acquire a working understanding of the industry, its markets and its products. This presentation is intended to provide a guide to understanding how to define one aspect of the industry's chemical needs: the demand (in value and volume terms) for active ingredients. Progress can be made in making volume estimates by adopting the following basic procedure:
When comparing these estimates with manufacturers statements (in press releases, annual reports and other sources) care must be used. One illustration of this: consumption errors introduced by sales of active ingredients between producers, which creates double counting. So-called "bottom-up" estimates of production, perhaps based upon reliable production statistics for key intermediates, can also be helpful in reconciling production and consumption estimates. Accuracy is less important than reliability. The difference between consumption and production over a given period of time is, of course, real. The two can be significantly different for several reasons, the most important of which is stockpiling. Farmers generally only buy agrochemicals if they really need them. Their need varies with the weather (affects weed growth and fungal attacks), insect plagues and (very importantly) crop prices. Thus the mismatch between production and consumption can be great. This factor is probably more dramatic in agrochemicals than in most other industry sectors. Underlying demand can be deduced from historical data and this can help in forward planning. Customers will typically combine captive production of an active ingredient with out-sourced material from one, maybe two third party suppliers. For this reason, producers can develop a distorted idea of the total customer demand, unless they maintain a good understanding of the overall consumption. Often customers are happy to allow producers to continue to believe they have a greater share of the production than is actually the case. Externally sourced statistics can be very helpful in ensuring the producer has a reliable market view. Estimating the production requirements of an agrochemical marketing company is thus a complex task, requiring much hard-to-get data and access to good sources of verification. Use of an independent source can make a vital contribution to the confidence planning managers are able to place in the information. This creates better business development plans and ensures that all market-led planning is firmly based on reliable information. The alternative approach in which the supplier relies only on:
usually leads to problems. Such informal information (if reliable) can be helpful in carrying out cross checks, but should not be the main basis for developing a picture of the market. Fine chemical and intermediates producers treat market research as "just a part-time chore" at their risk. Generating Demand and Market Value Data Collecting information on the amount of formulated agrochemicals being used around the world is a major undertaking. Various specialist groups have been set up to generate this type of data. They include Doane (USA), Produce Studies (covers most markets except the USA), Klefmann (Europe) and Agricultural Information Services (Japan). By carrying out statistical surveys of what farmers have used (and the prices they have paid) during a season, detailed statistics are collected by these companies. The data is then sold to companies in the form of tailor-made reports. These companies' activities would seem to offer an ideal solution to the needs of producers looking for market data. However, the data is expensive to collect and therefore costly to purchase. While the expense can be carried by an important project, it is difficult to justify paying for a global study (running into tens of thousands of US dollars) for everyday planning studies. The basic problem is that the appropriate degree of detail required for general work is not available from these companies. When calculating the production of a given agrochemical active ingredient, an accuracy of ± 15% is perfectly adequate for the needs of a chemical supplier, so long as it is reliable. Having identified the need for this type of planning information, Agranova and Allan Woodburn Associates Ltd have created the first affordable survey of the volume and value (at the end-user level) of the agrochemicals used in 85% (by value) of the global crop sectors. Illustrations of the results obtained (just published as Crop Sector Reviews3) will be shown in the presentation. A few illustrations are provided in Tables 1-4 . Table 1:
Table 2:
Table 3:
Table 4:
When consulting this type of information, it is important to keep in mind the basis and scope of the data. The tables shown above list the value (at the end-user level) and the consumption (in metric tons) of the quoted active ingredient in the crop sector stated. Clearly, having an estimate of the value of the market for an agrochemical active at the end-user level, provides a corresponding price for that active ingredient, at the end-user level. In order to produce an estimate of the active ingredient at the ex-factory level, certain deductions have to be made. These include:
These additional costs are different for each market, so a global price estimate is necessarily approximate. Nevertheless, a factor of around 2.0-2.5 times is usually realistic and an approximate ex-factory price may thus be calculated. From this figure, useful comparisons with cost estimates generated from raw material cost estimates (or better: variable cost estimates) may be made. An idea of the margins being generated for the active ingredient is therefore available. Care must be taken to allow for the likely scale of manufacture, since overheads and allocated cash costs are significantly less for a 2,000 metric ton per year product than is the case for one being produced at 200 metric ton per year.
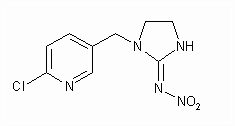
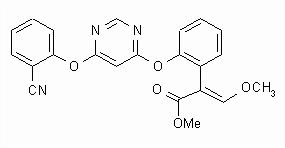
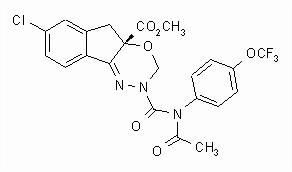
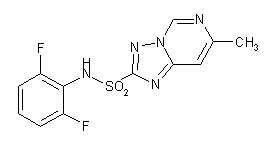
Demand for Agrochemical Intermediates Developing a perspective on the consumption of an agrochemical active ingredient is very often required for estimating the corresponding demand for a key intermediate. Information on the routes of manufacture, based upon patent disclosures, is relatively easy to find. Indeed several specialist publications show extensive process flow sheets for many commercial agrochemicals4. As is often the case with published information, care must be taken to check the routes claimed. It is very often the case that the patented routes are not commercially viable, particularly in the case of agrochemicals, where the costs have to be kept to a minimum in order to ensure commercial as well as technical success. In many cases, the patented synthesis is simply not workable on any reasonable scale. In others, expensive reagents used in the laboratory are just too costly for manufacturing routes. In other cases, commercial routes have been designed to avoid conflicts with process patents. Whatever the reason, basing commercial decisions on patent descriptions of technology is a poor policy. Examples will be presented in the talk. As with so much fine and intermediate chemical commercial development, use of other sources of market intelligence is an essential part of building a reliable picture of the competitive situation. Merely having a technological strength that appears appropriate is seldom a sufficient determinant for success, but industry players all too often forget this important truth. Before concluding this brief review, one other aspect of maintaining a winning perspective of the agrochemical sector involves keeping in touch with the future technology demands being made by the research and development chemists who work in the innovative agrochemical sector. Over the past ten years, agrochemical research has become much more science-based (in contrast to earlier "spray and pray" approaches to product discovery). Figures 1-4 illustrate some of the newer structural types that have made important impacts upon the industry over the past 5-10 years5. Chemical producers having access to chemistries and technologies suitable for producing such compounds have the possibility to harness them to develop sales in the sector, always assuming that all other factors are equal. Figure 1: Imidacloprid - a neonicotinoid insecticide
Figure 2: Azoxystrobin - a strobilurin fungicide
Figure 3: Indoxacarb (p) - a chiral oxadiazine insecticide
Figure 4: Flumetsulam - a triazolopyrimidine herbicide
Conclusions During the past 10-15 years the consolidation of the agrochemical discovery industry has been remarkable. During that time, the major US and European companies involved in this activity dropped from 43 to just 176. Similarly in Japan, the 32 discovery companies dropped from 32 to 22 between 1989 to 19996. This consolidation has led to a concentrated market with the top ten companies commanding over 80% of the total global agrochemical market (Table 5 )1. Table 5: (currencies exchanged at average rates for 1998)
* to be merged under the name of Aventis (which will make it the top selling company) from the end of 1999 These ownership changes and company exits have been driven by a continuing loss in industry profitability. The reasons for these poorer results are many, but two key factors are the increasing difficulty the industry has found in expanding sales and the increasing costs associated with R&D and registration costs. Sales growth averaged over 10% annually during the 1960's; during the past ten years, sales growth has languished at around an average of 0.6% per year. The abortive experiments in creating "lifescience" companies have also taken its toll in reducing the effectiveness of the industry. Nevertheless, there are positive signs for the chemical intermediates industry:
As the world's population continues to grow, demand for improved crop protection agents will continue to grow, albeit in an irregular fashion, with peaks and troughs. Chemical intermediate and active ingredient suppliers will continue to need reliable information on the development of new agrochemicals and the principles set out in this presentation will certainly assist them to ensure their business planning is well designed and successful. References
Copyright © 2003 Agranova |
|||||||||||||||||||||||||||||||||||||||||||||||||||||||||||||||||||||||||||||||||||||||||||||||||||||||||||||||||||||||||||||||||||||||||||||||||||||||||||||||||||||||||||||||||||||||||||||||||||||||||||
| |
||||||||||||||||||||||||||||||||||||||||||||||||||||||||||||||||||||||||||||||||||||||||||||||||||||||||||||||||||||||||||||||||||||||||||||||||||||||||||||||||||||||||||||||||||||||||||||||||||||||||||||
| ©2026 Agranova | Terms & Conditions | |||||||||||||||||||||||||||||||||||||||||||||||||||||||||||||||||||||||||||||||||||||||||||||||||||||||||||||||||||||||||||||||||||||||||||||||||||||||||||||||||||||||||||||||||||||||||||||||||||||||||||


